

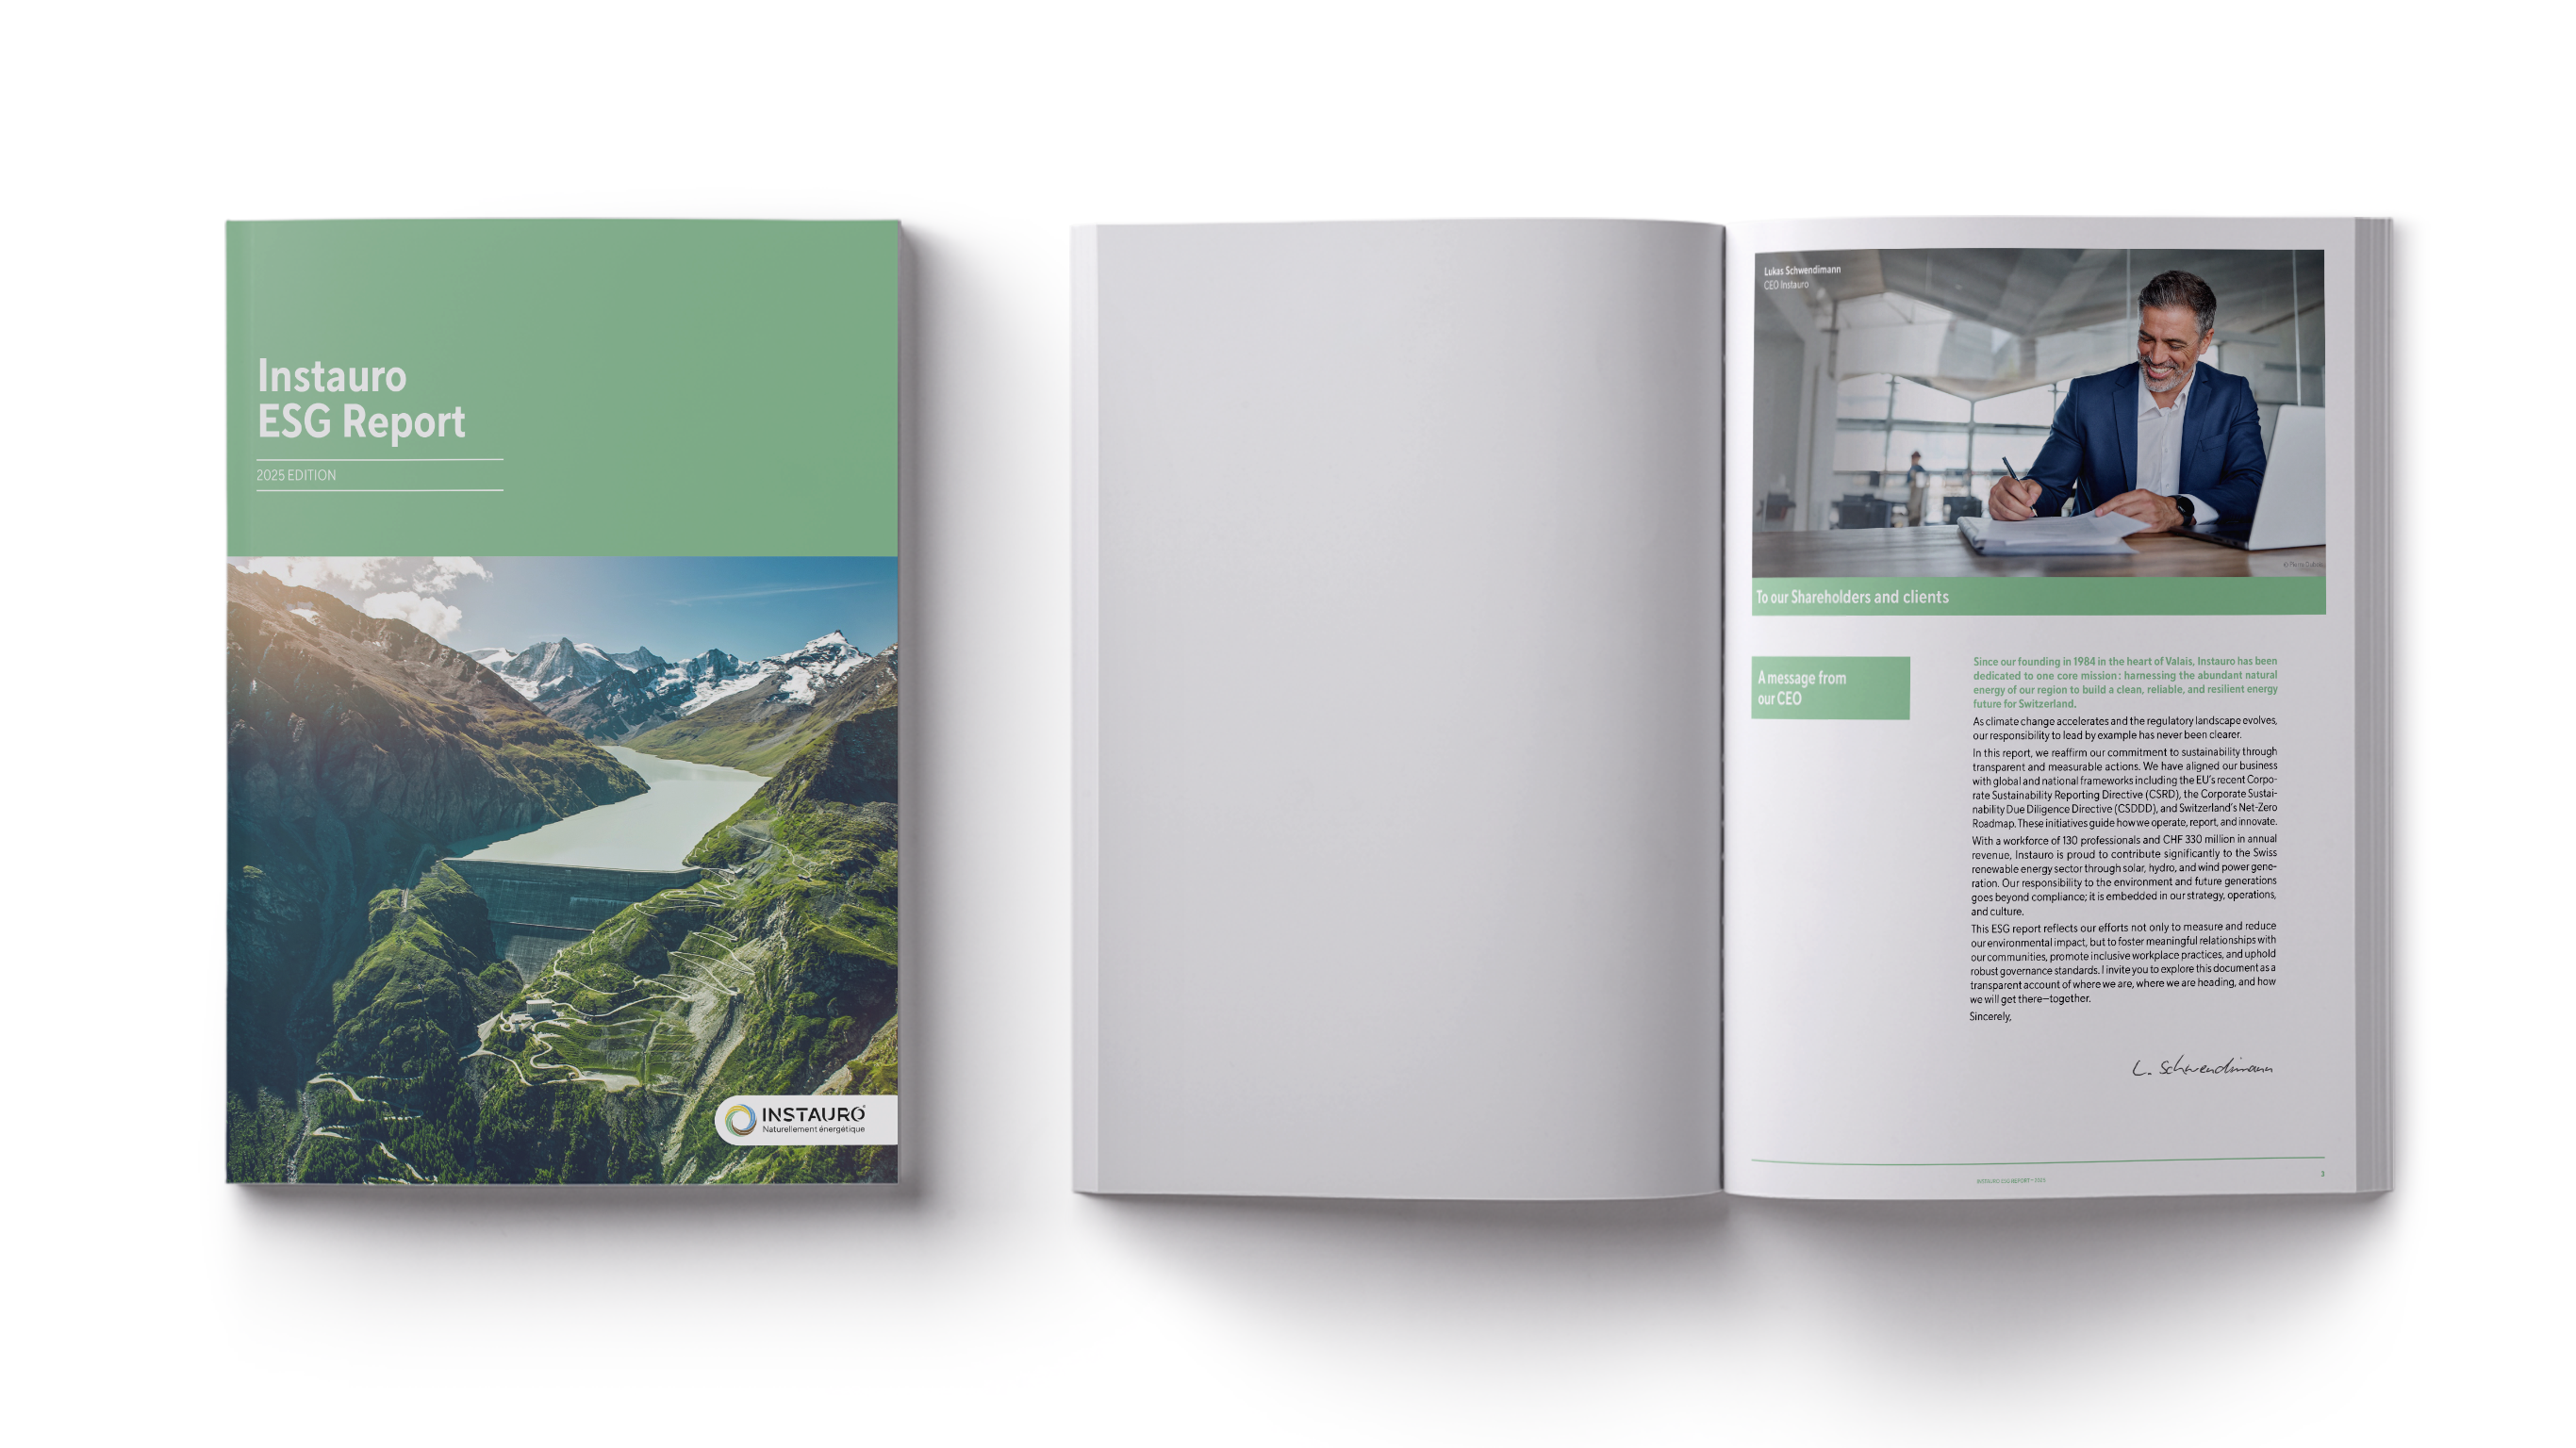
Instauro's ESG report
Instauro is a fictitious renewable energy company based in Switzerland. As a personal project, I decided to design their visual identity and apply it to their upcoming ESG report for 2025.
ESG managers often face the challenge of turning complex sustainability data into clear and convincing ESG reports for stakeholders. This project demonstrates how sustainable graphic design can make their company documents credible and convincing.
Deliverables:
Brand guidelines and an A4 ESG report (PDF files)
Choice of paper:
Refutura
Project duration:
5 weeks
Benefits of our collaboration
Without clear art direction, ESG reports can feel complicated, hard to navigate, and uninspiring to read.
Through a collaborative, sustainable design approach, I helped my ESG manager transform his complex data into clear, credible visuals that helped to build trust with shareholders.
Benefits of our collaboration include:

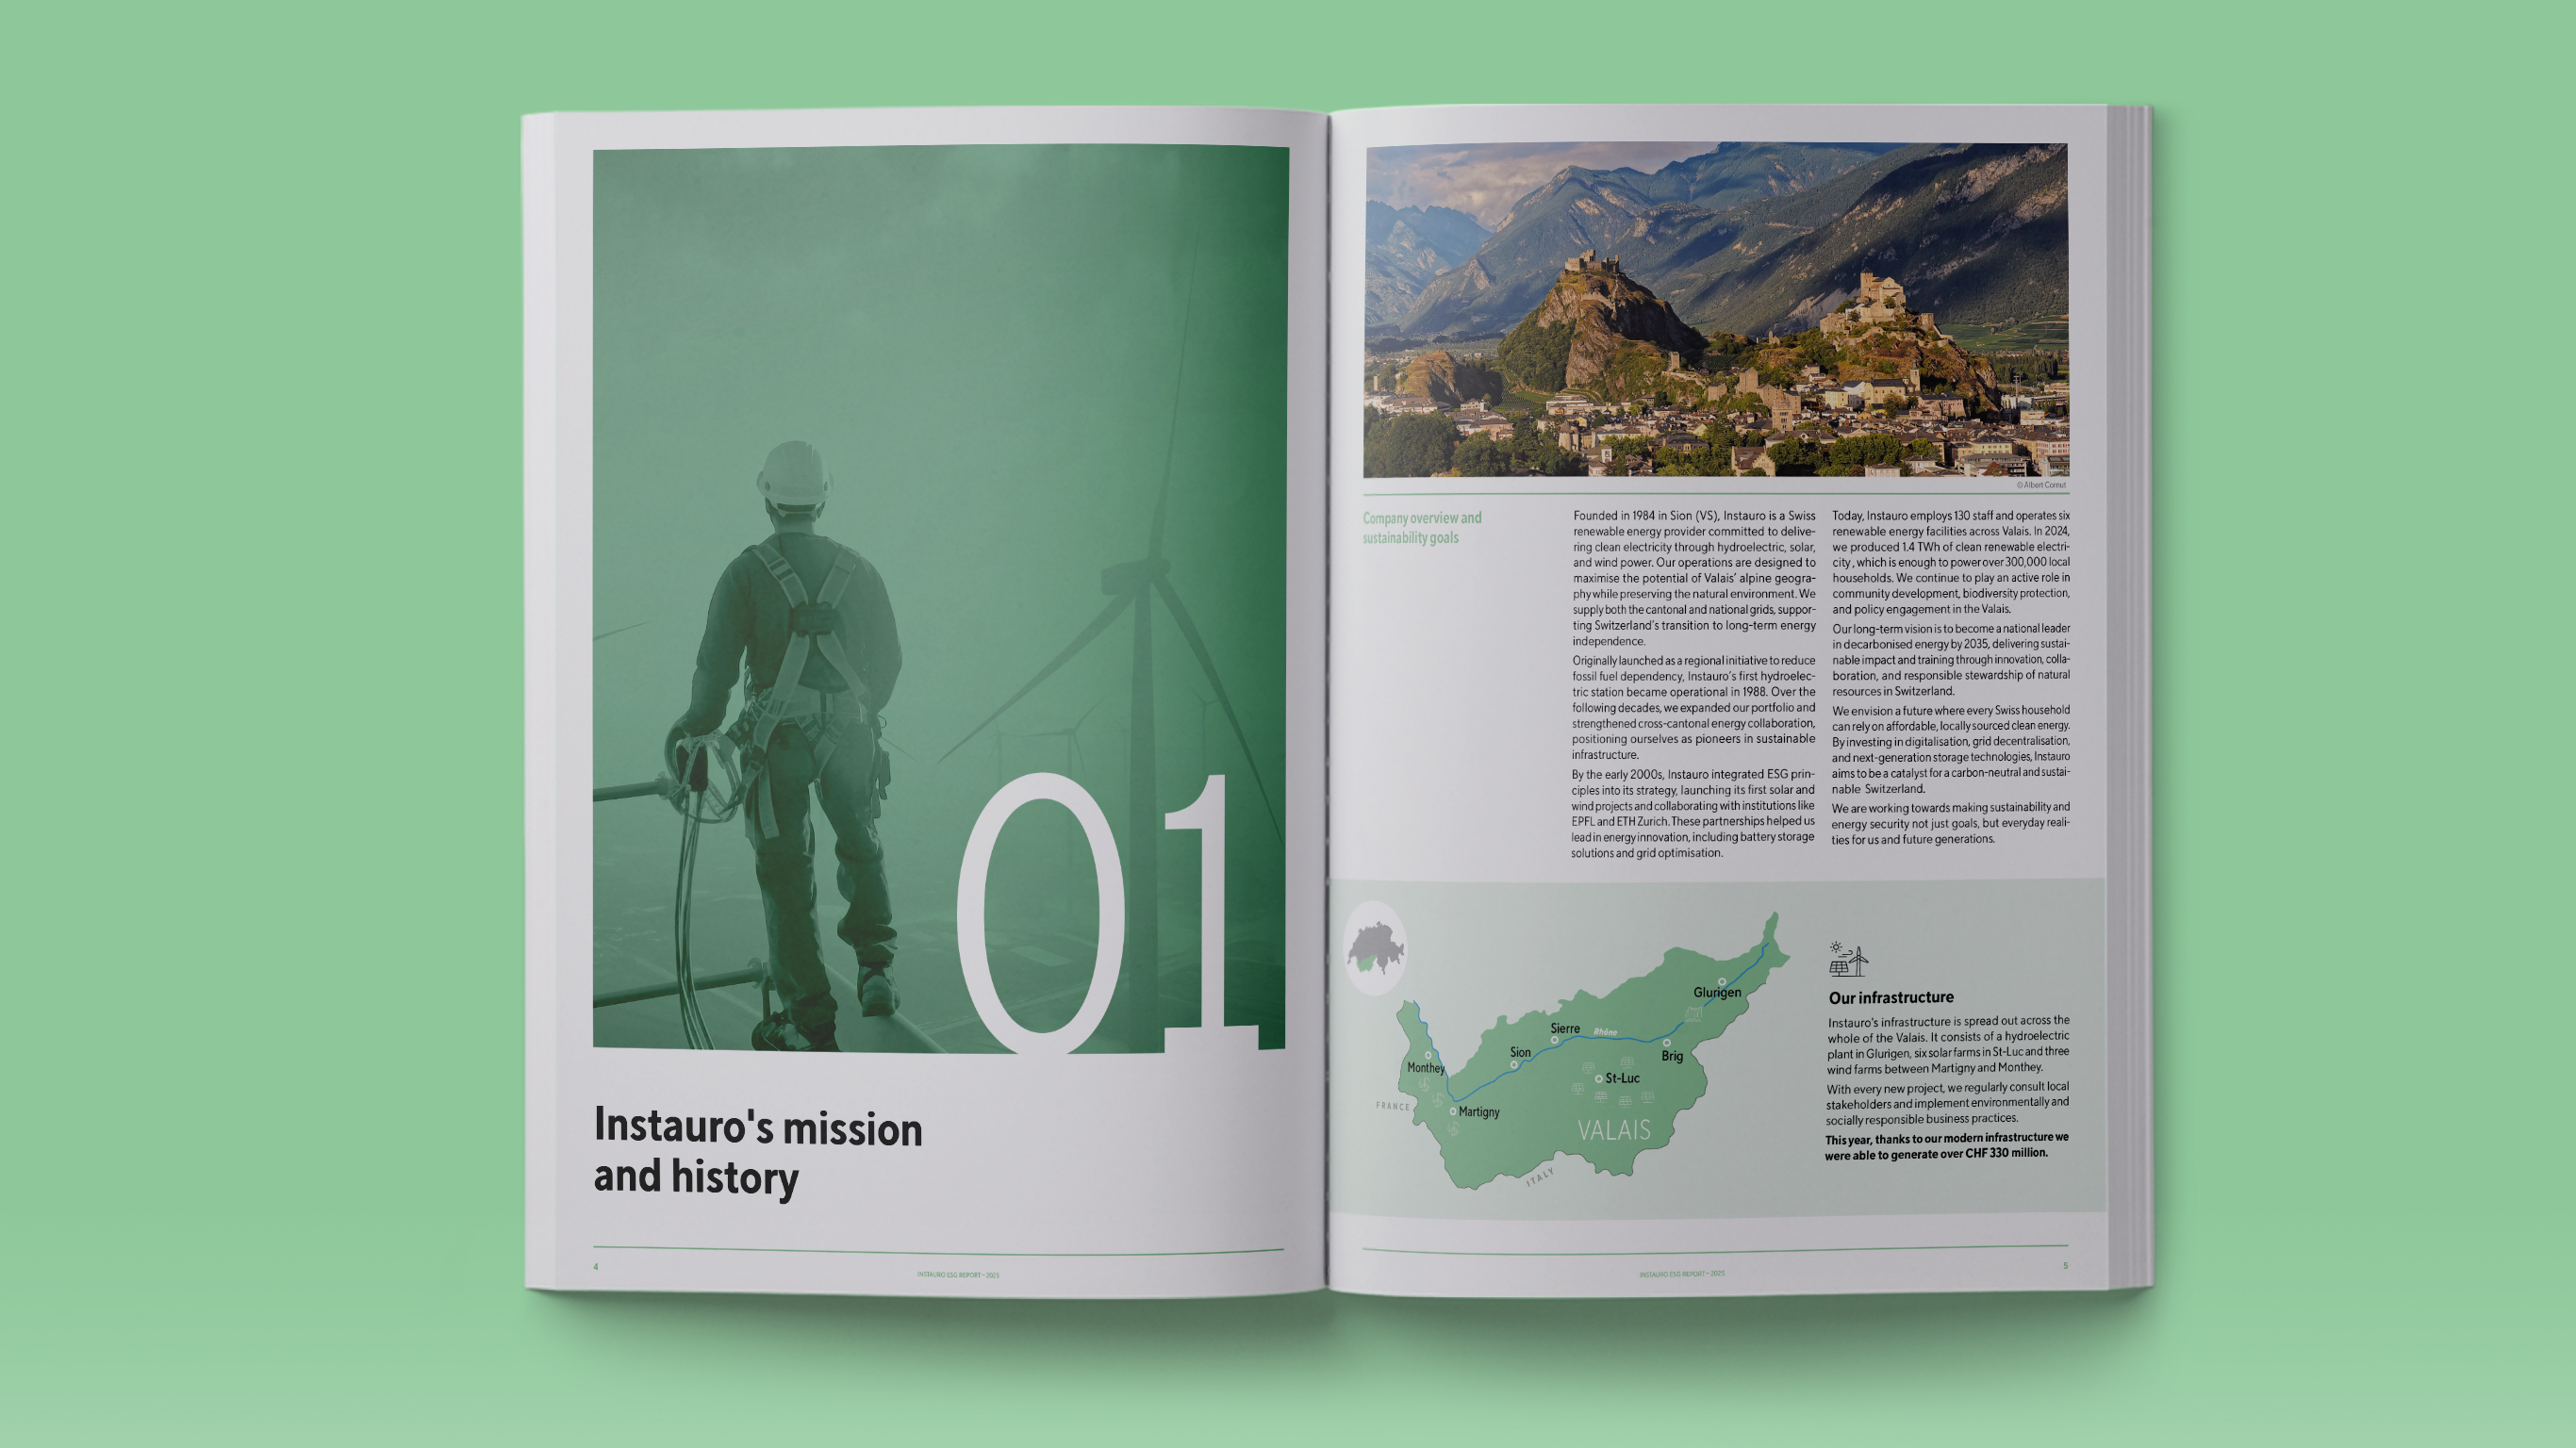
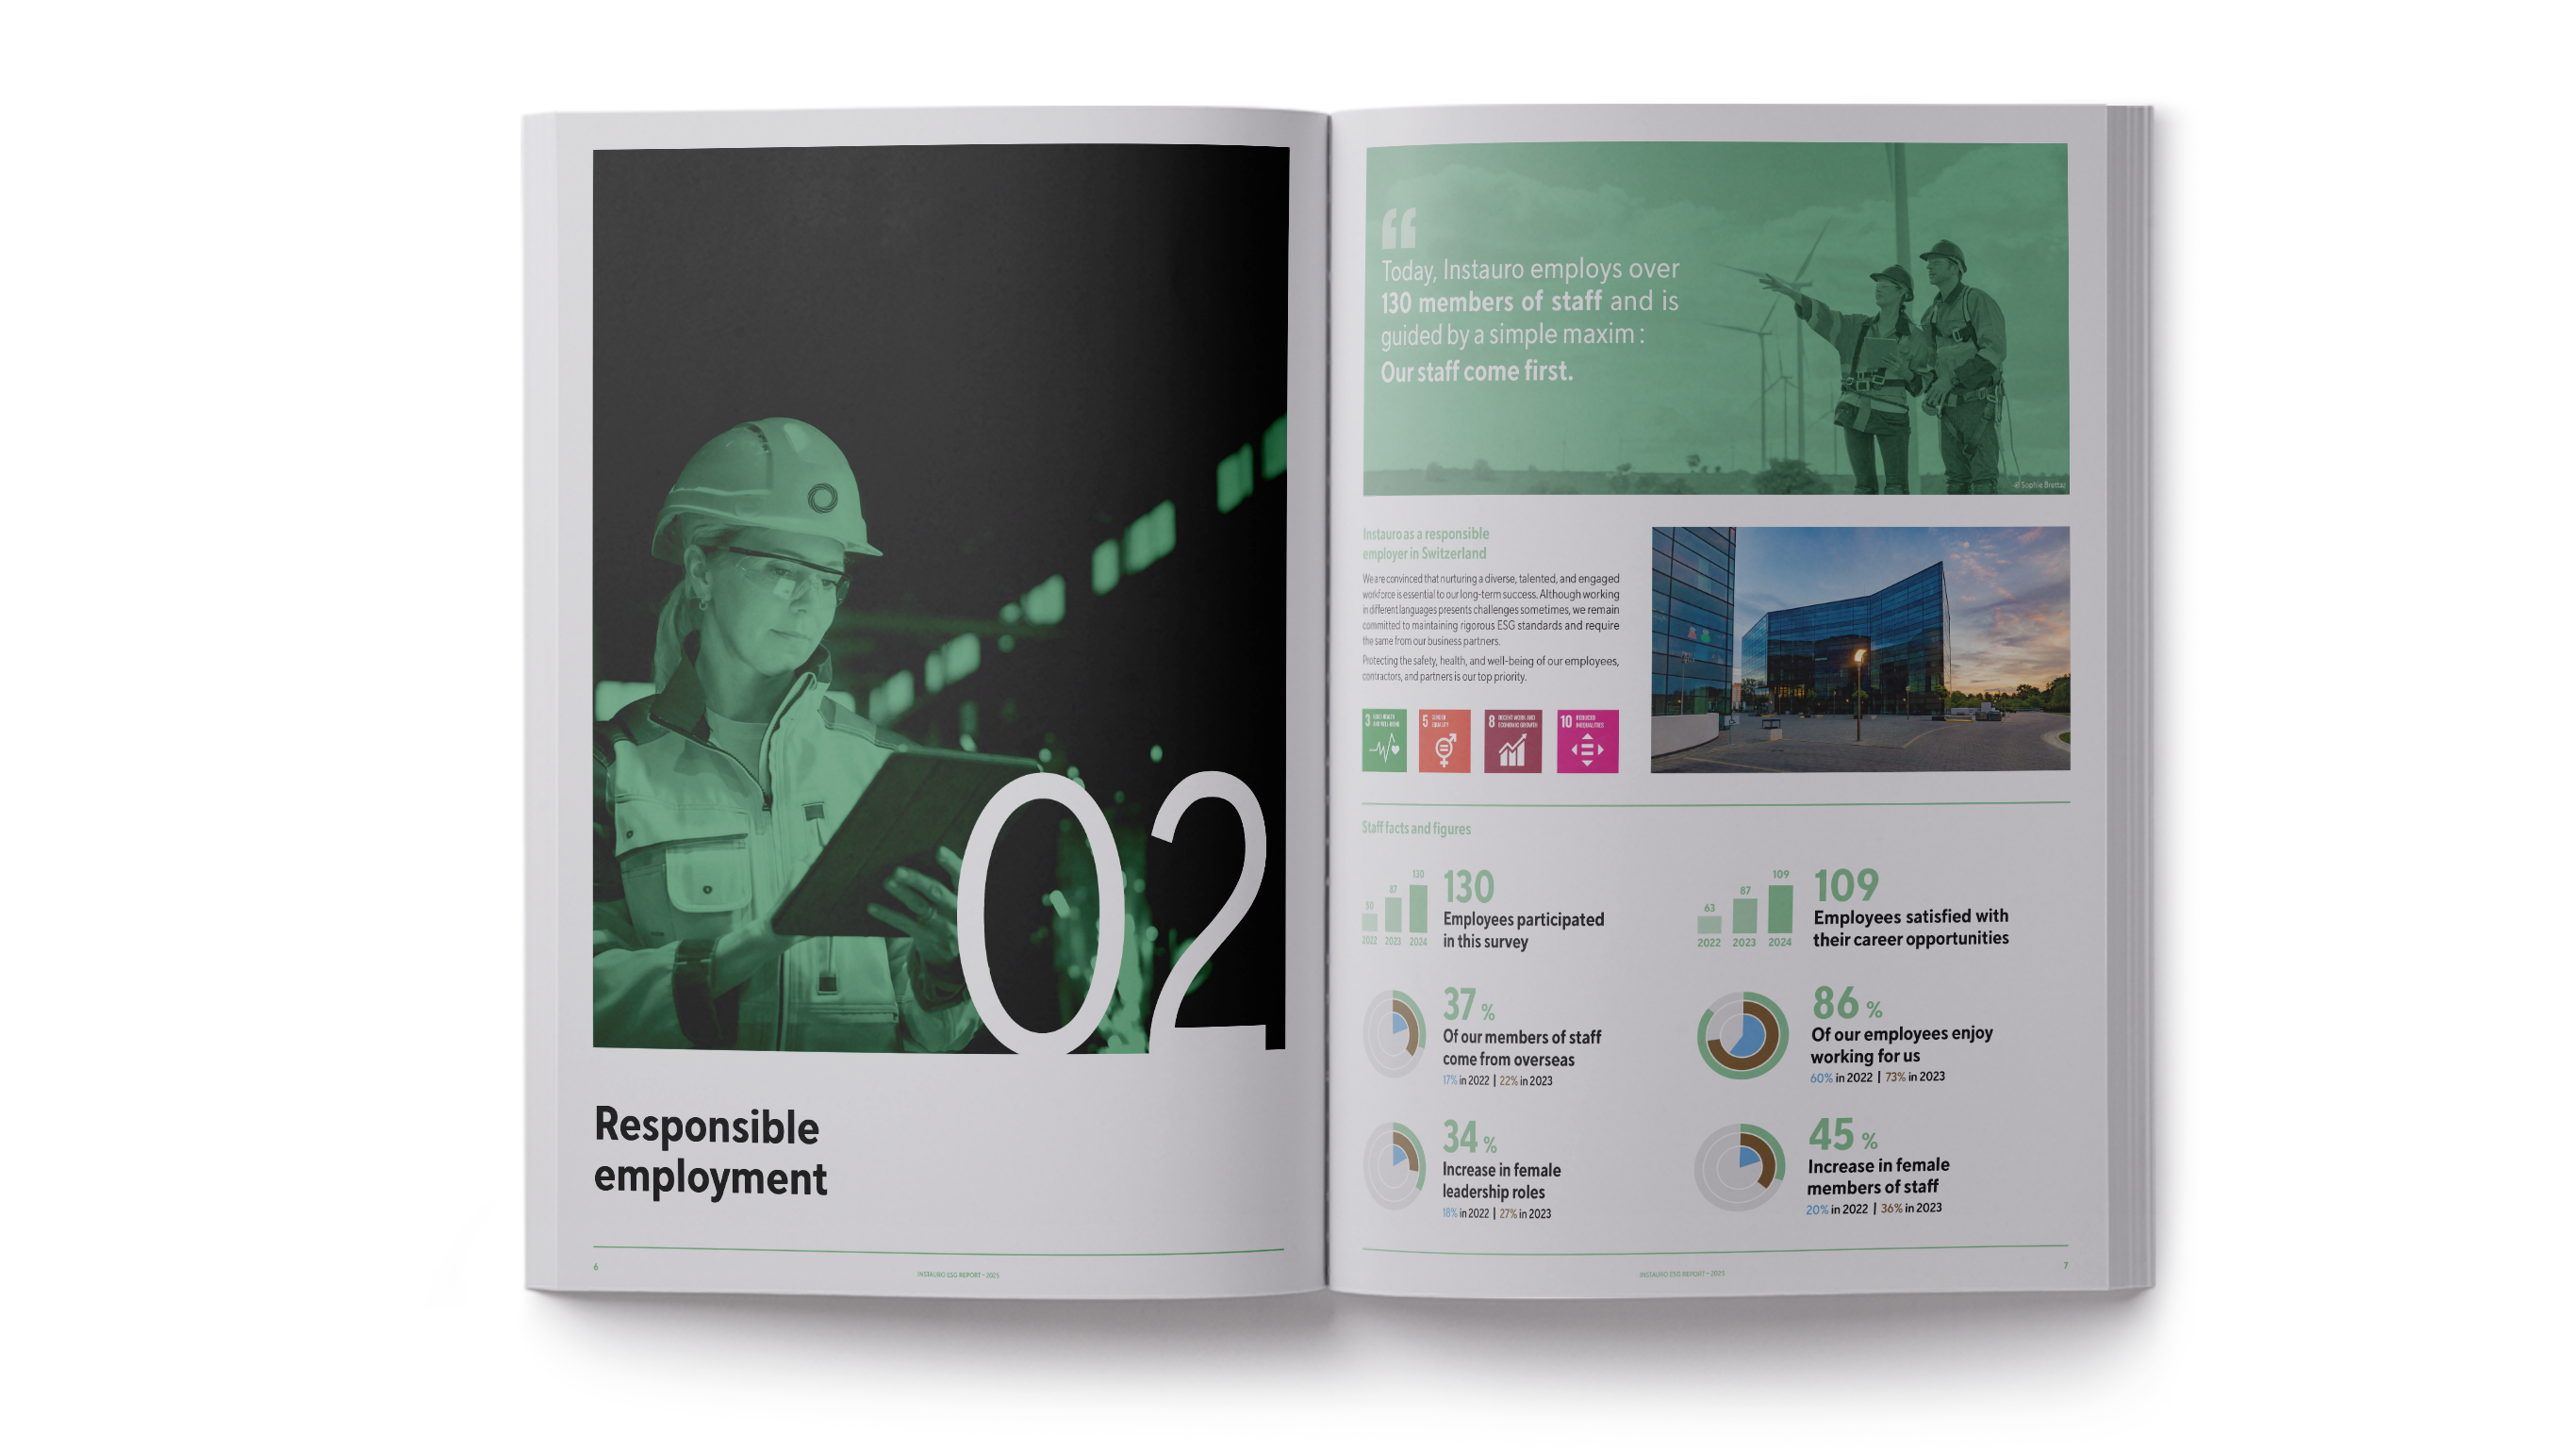
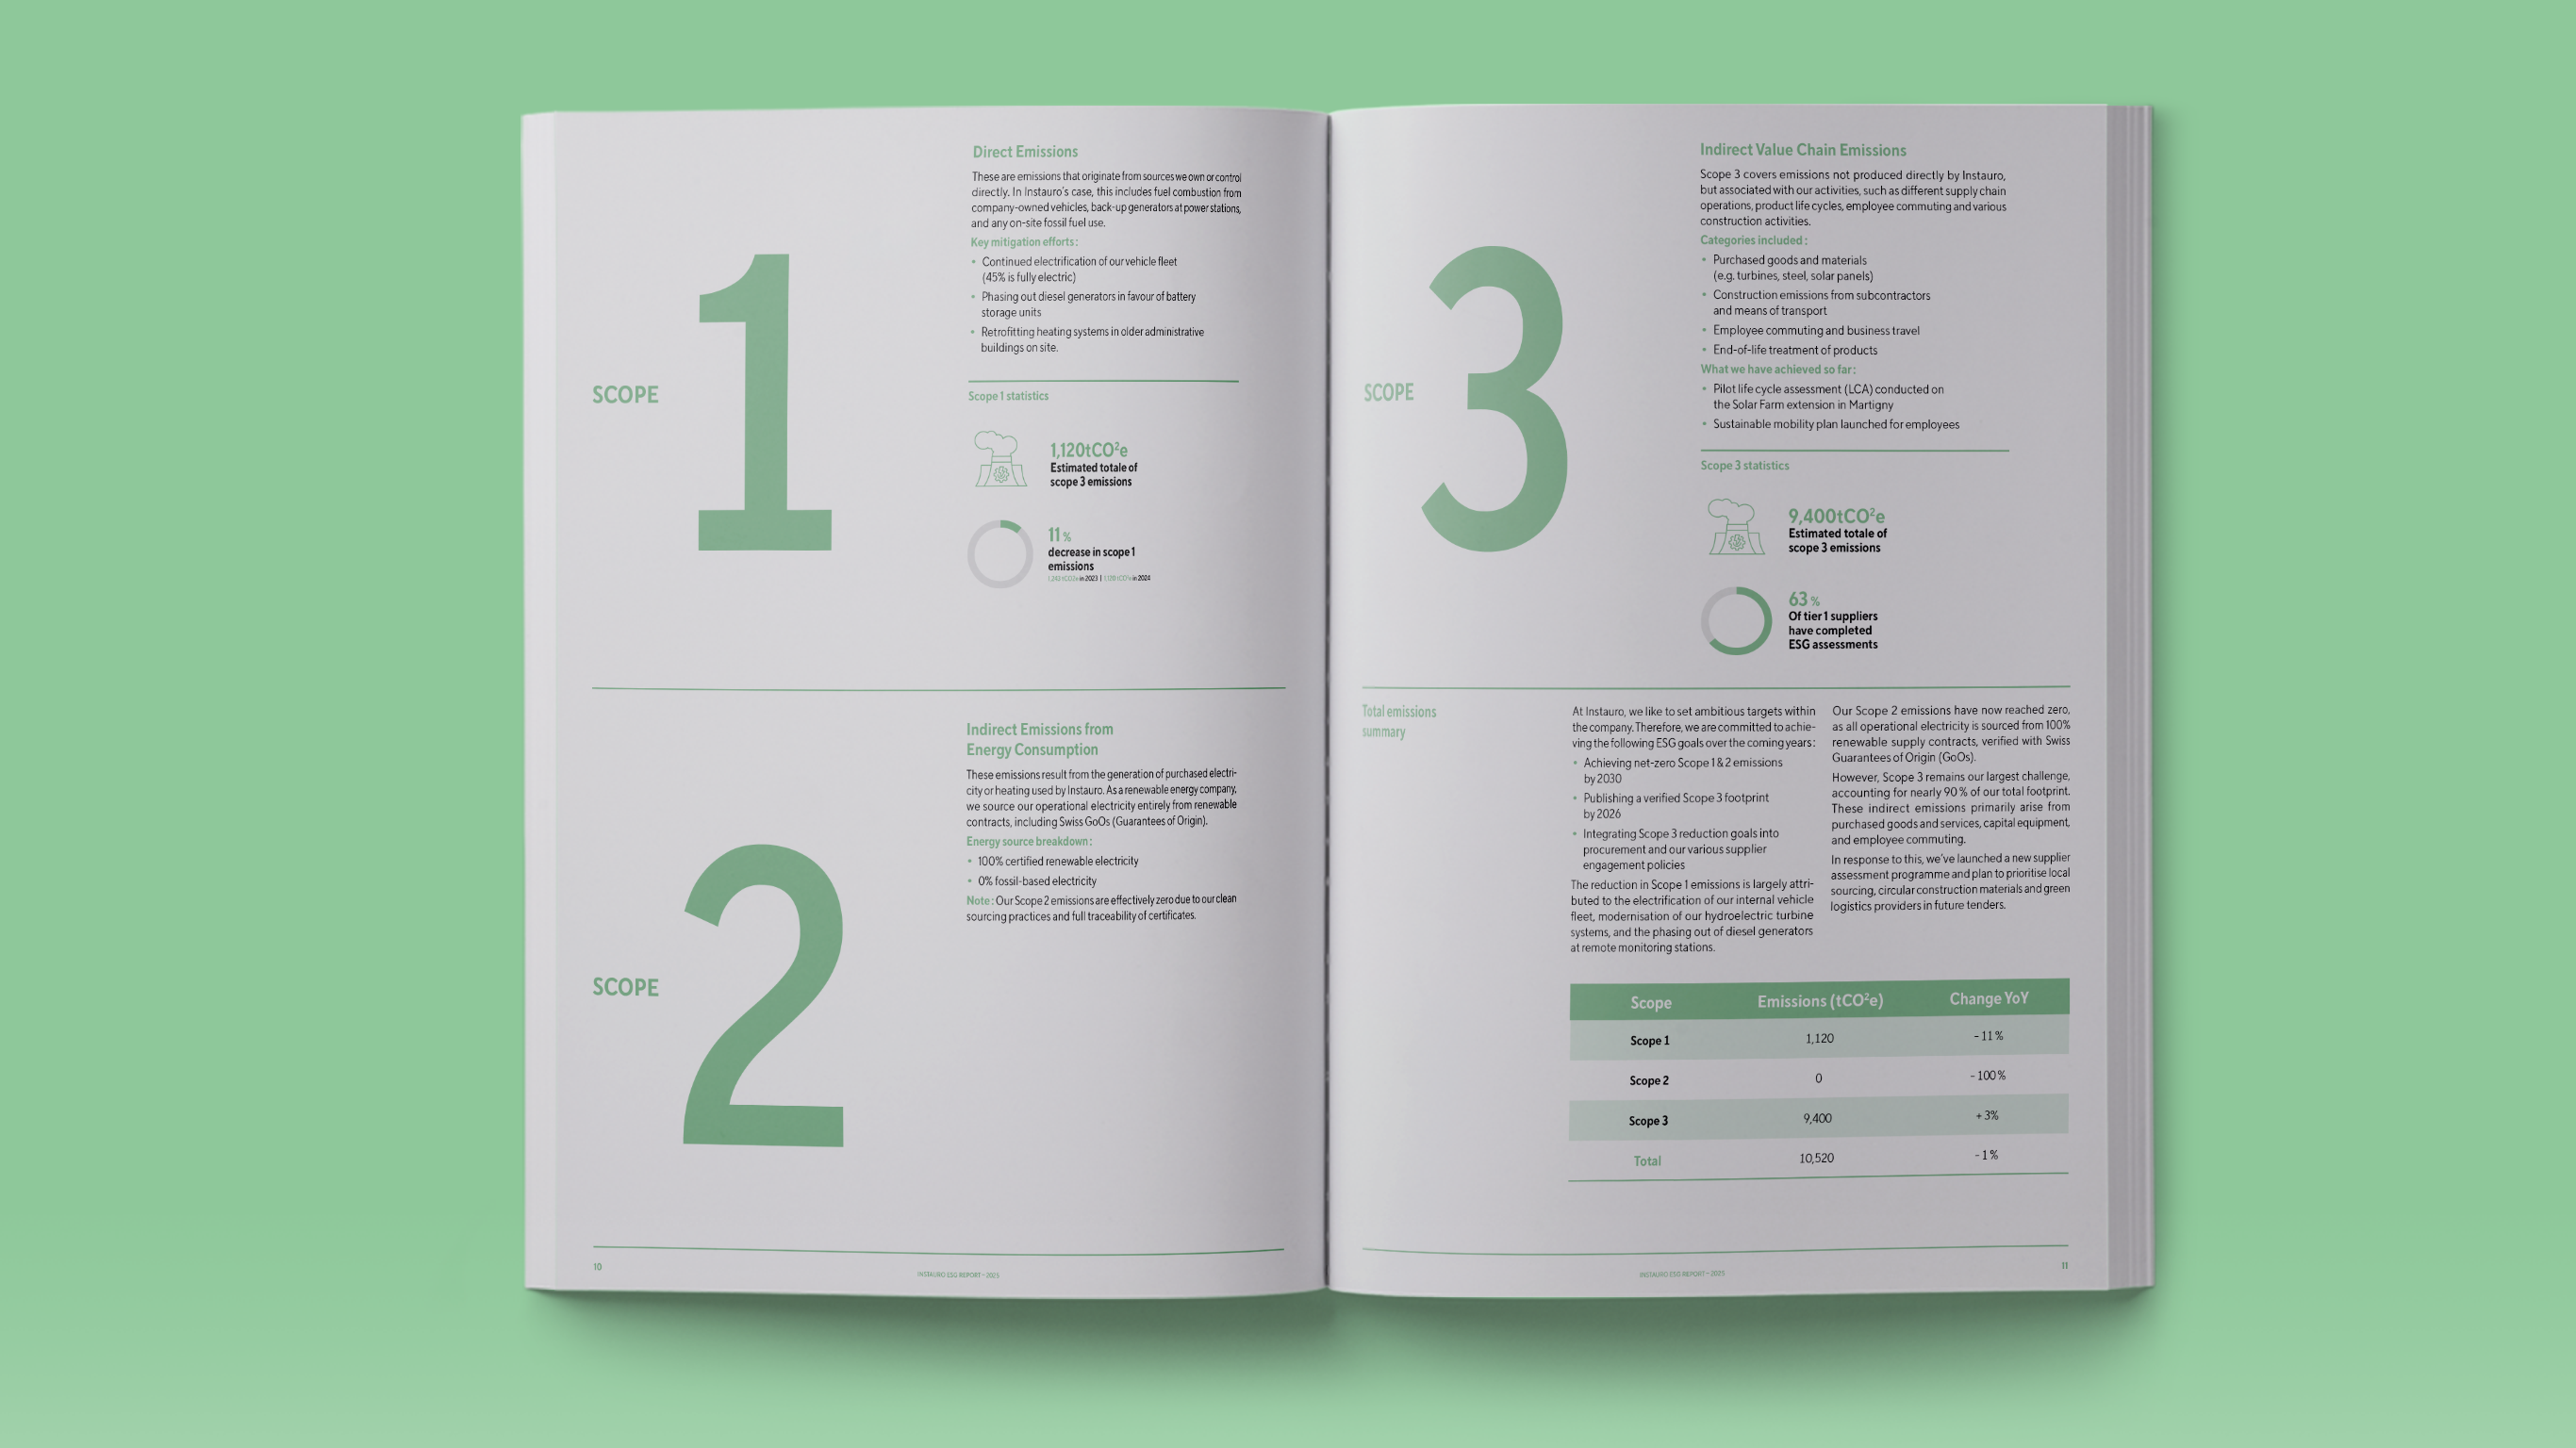
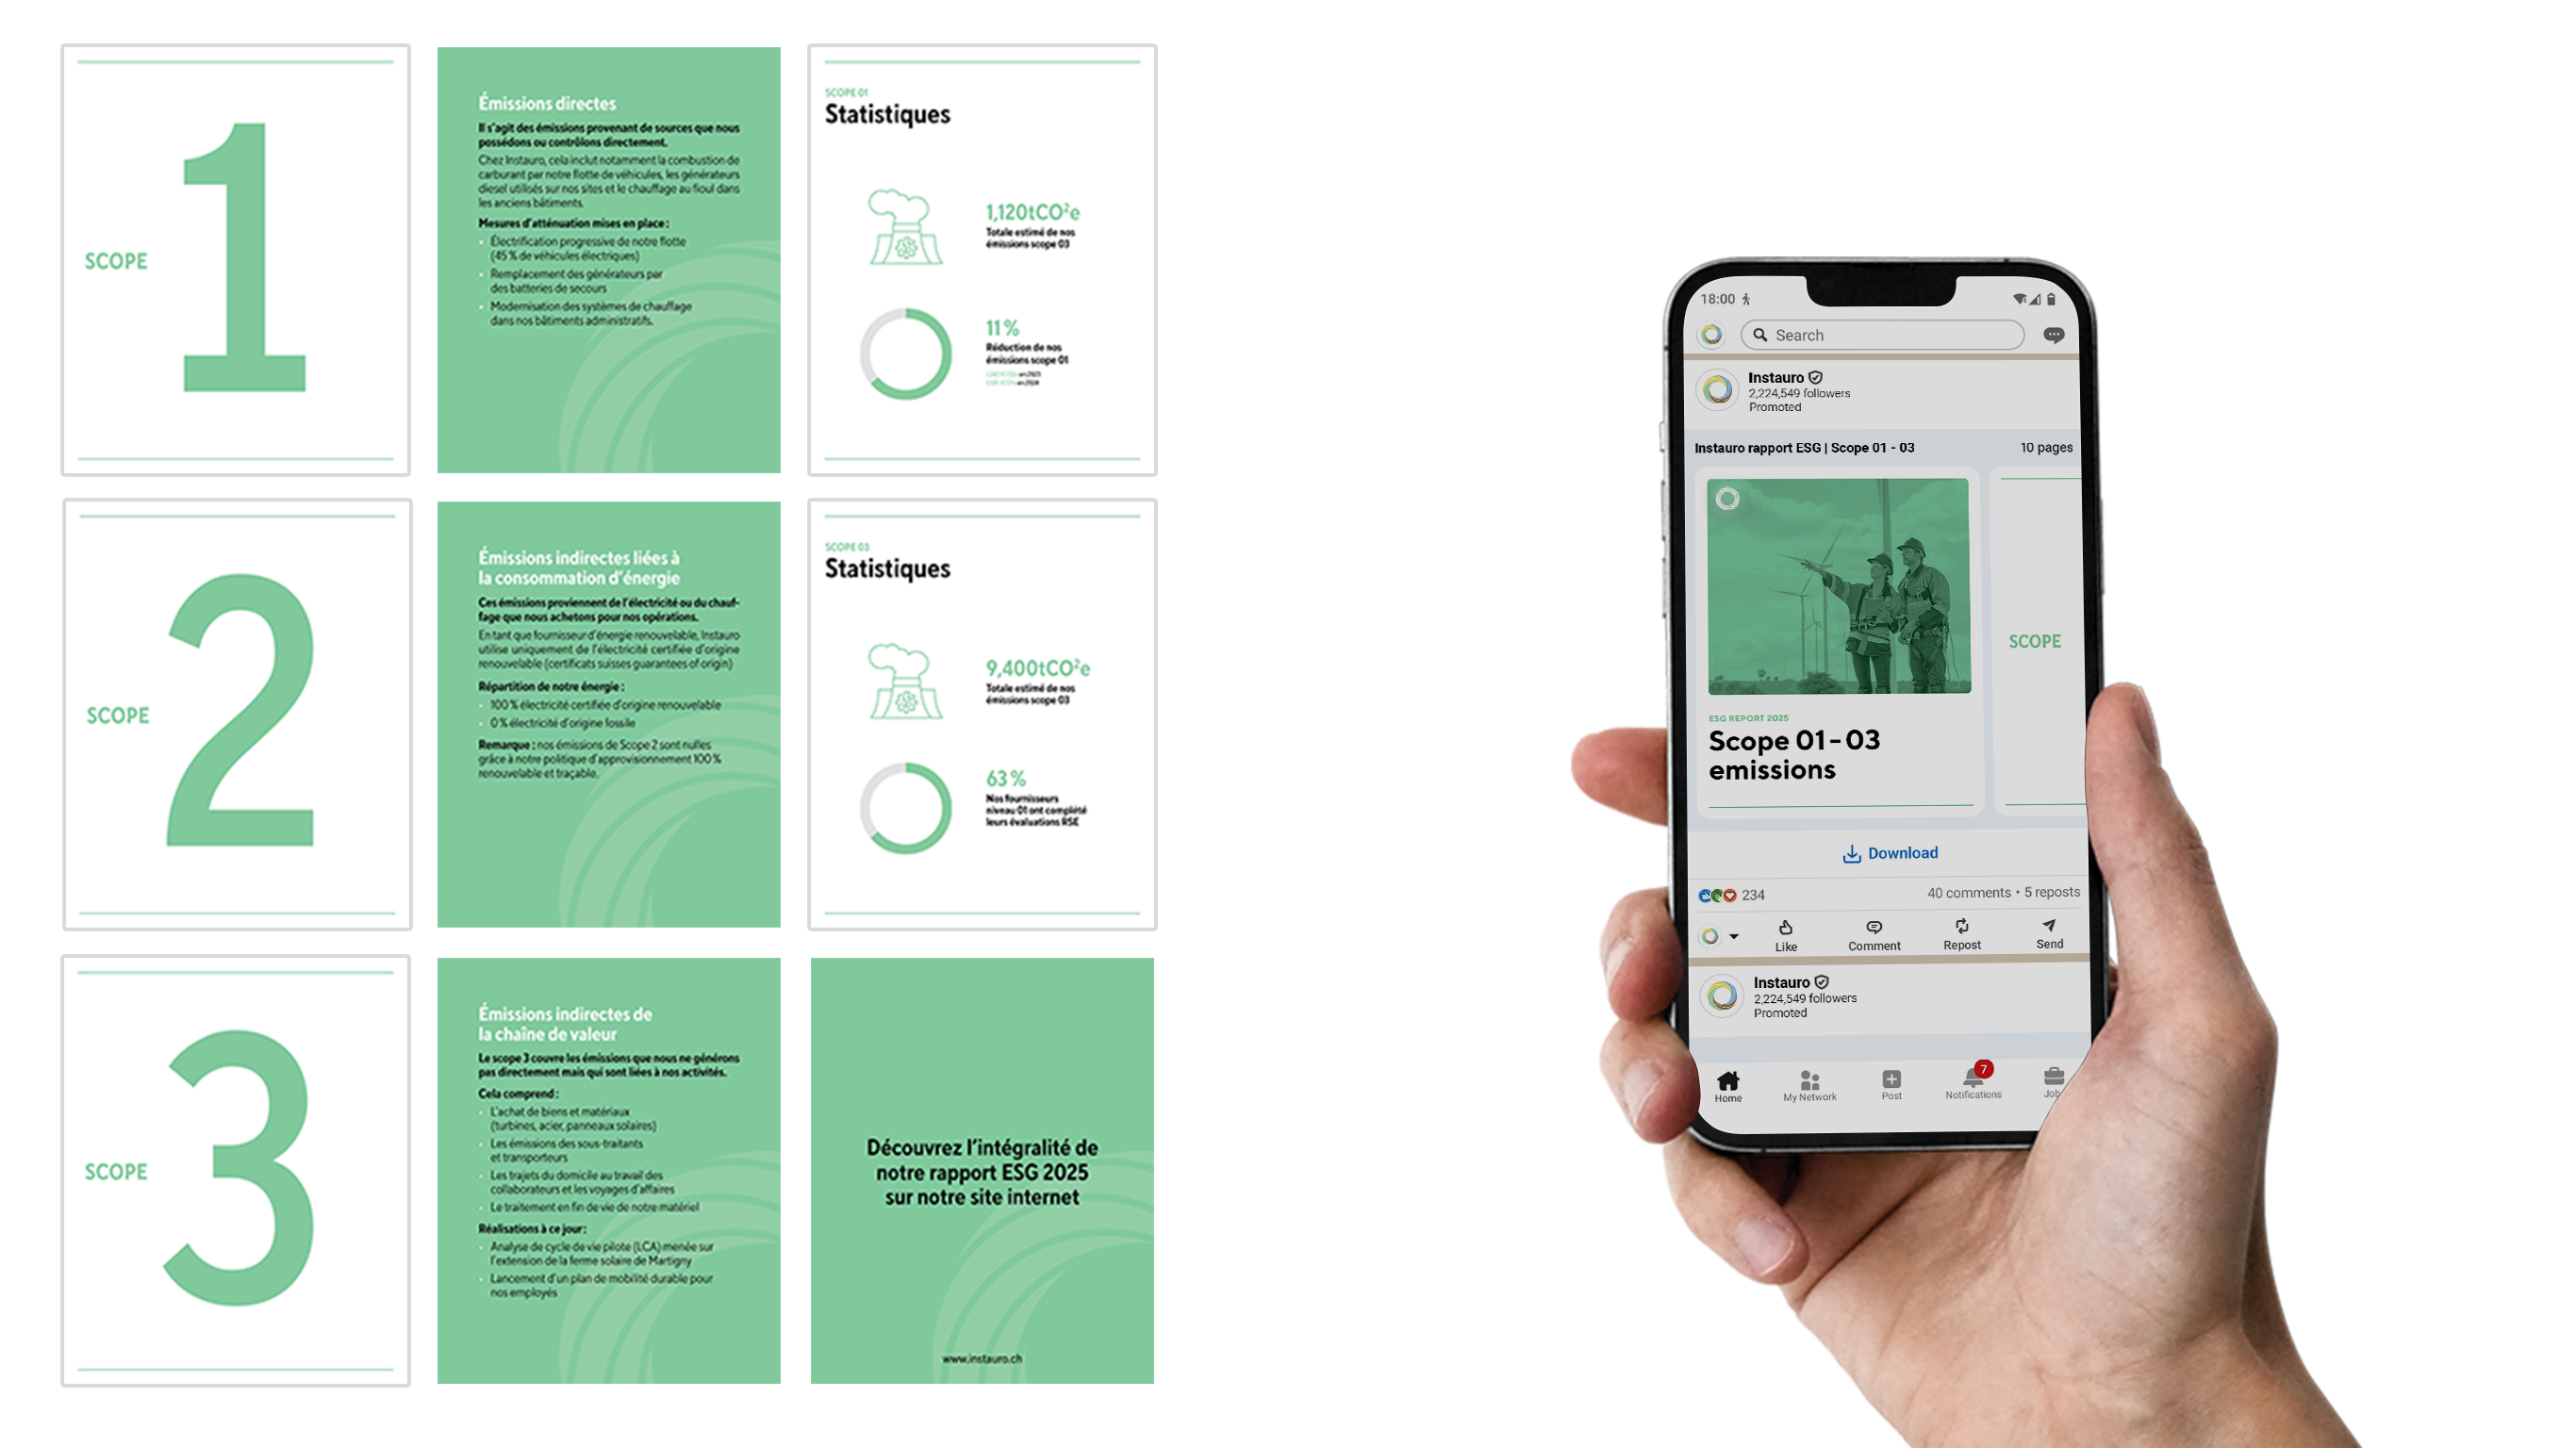
Simplifying complex data, using clear infographics and visual storytelling.
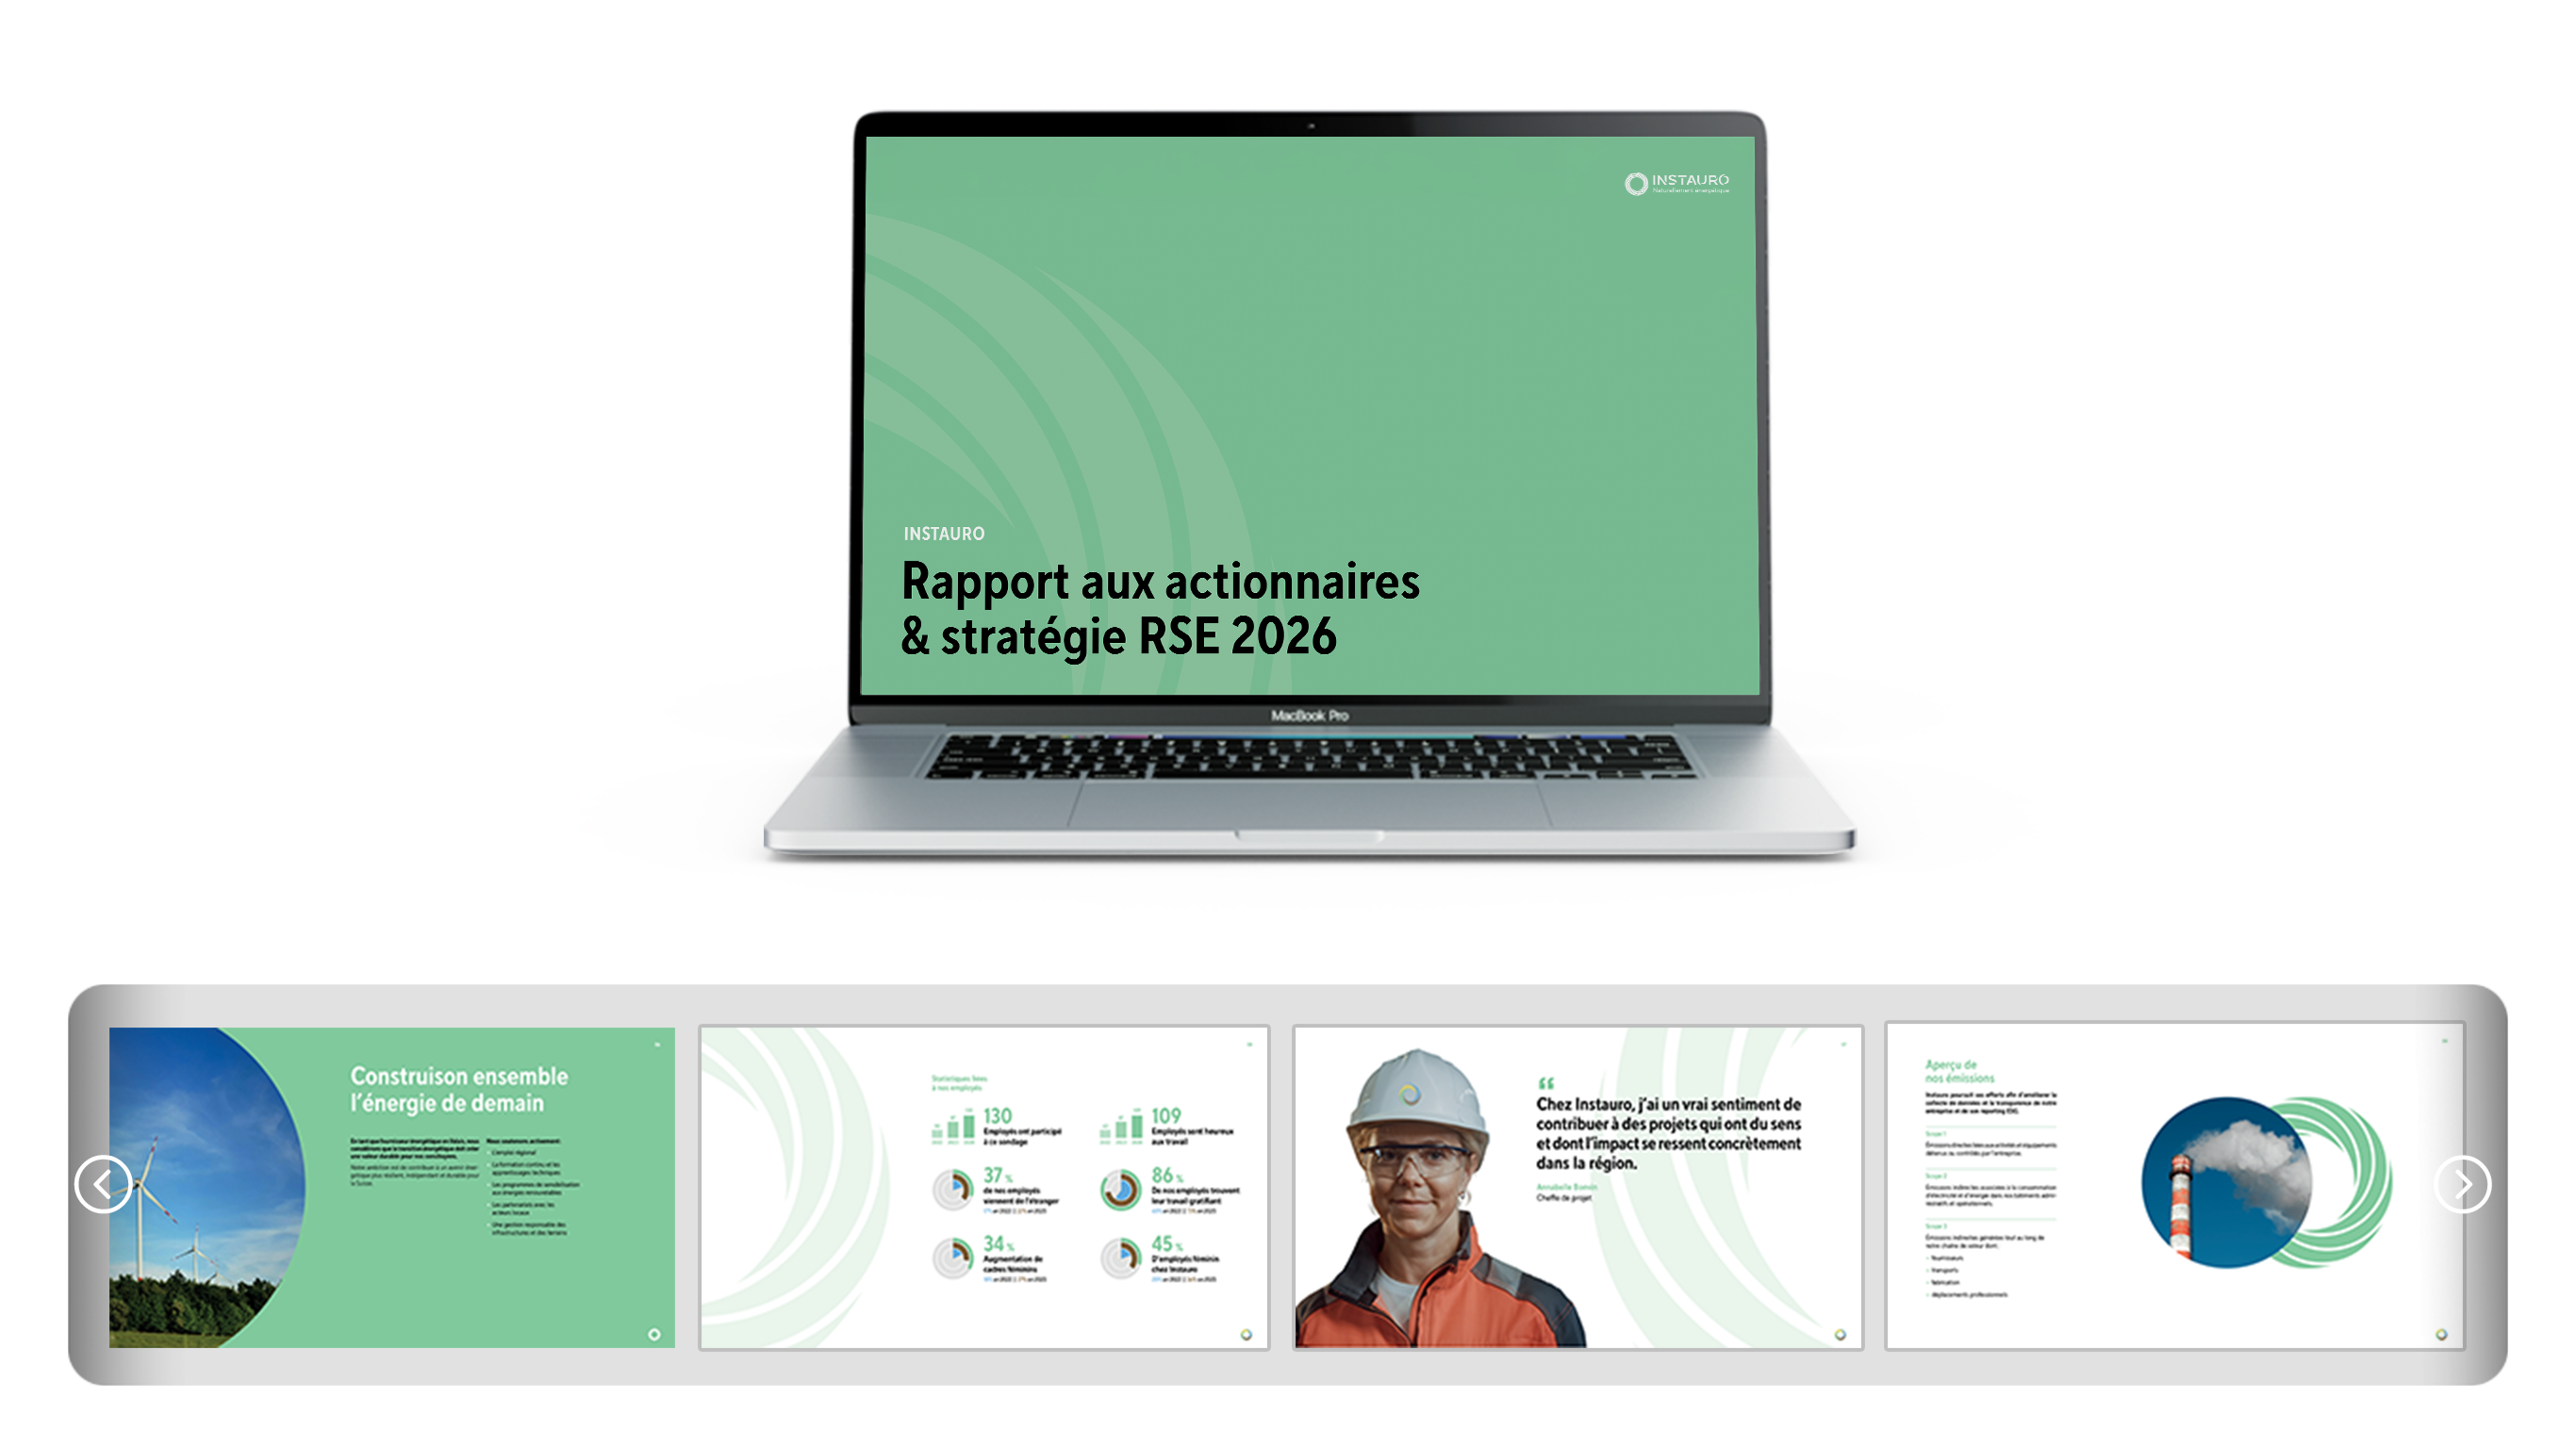
Designing a clear and defensible ESG report that inspires stakeholder trust.
A streamlined design process that saved my client alot of time and energy at work.

What is the environmental impact of this project?
My client chose to print their marketing materials on eco-friendly paper (see project details).
This decision not only showcases the company's dedication to sustainability but also minimizes natural resource consumption, for this project.
Check out the following statistics to see the exact amounts of wood, CO2, energy, and water used during production.
Source: Paper calculator 4.0Sustainable vs virgin fibre paper
Did you know that choosing virgin fiber paper for your marketing materials consumes on average, more natural resources than recycled or alternative fiber paper?
The pie charts below illustrate the big difference your small decision can make, in regards to protecting the environment.
This is the subtitle text below my json file of an animated pie chart.
My text is written over three lines
This is the subtitle text below my json file of an animated pie chart.
My text is written over three lines
This is the subtitle text below my json file of an animated pie chart.
My text is written over three lines
This is the subtitle text below my json file of an animated pie chart.
My text is written over three lines
Would this type of project interest your company?
If this project has caught your attention and inspired new ideas for your company, I would love to hear your thoughts via email.
get in touch